Adapted from glab.library::PCA_from_file.
Usage
run_PCA(
  df,
  savename = NULL,
  summary = FALSE,
  center = TRUE,
  scale = FALSE,
  tol = 0.05,
  rank = NULL,
  screeplot = TRUE
)
Arguments
- df
(path to) numeric dataframe; samples as columns, genes/features as rows
- savename
string; filepath (no ext.) to save PCA scores, loadings, sdev under
- summary
logical; output summary info
- center
logical; indicate whether the variables should be shifted to be zero centered
- scale
logical; indicate whether the variables should be scaled to have unit variance
- tol
numeric; indicate the magnitude below which components should be omitted
- rank
integer; a number specifying the maximal rank, i.e., maximal number of principal components to be used
- screeplot
logical; output + save screeplot?
Details
In general, Z-score standardization (center = T; scale = T) before PCA is advised. For (transformed) gene expression data, genearlly, center but don't scale.
center = T: PCA maximizes the sum-of-squared deviations from the origin in the first PC. Variance is only maximized if the data is pre-centered.
scale = T: If one feature varies more than others, the feature will dominate resulting principal components. Scaling will also result in components in the same order of magnitude.
Use either tol or rank, but not both.
Examples
data(iris)
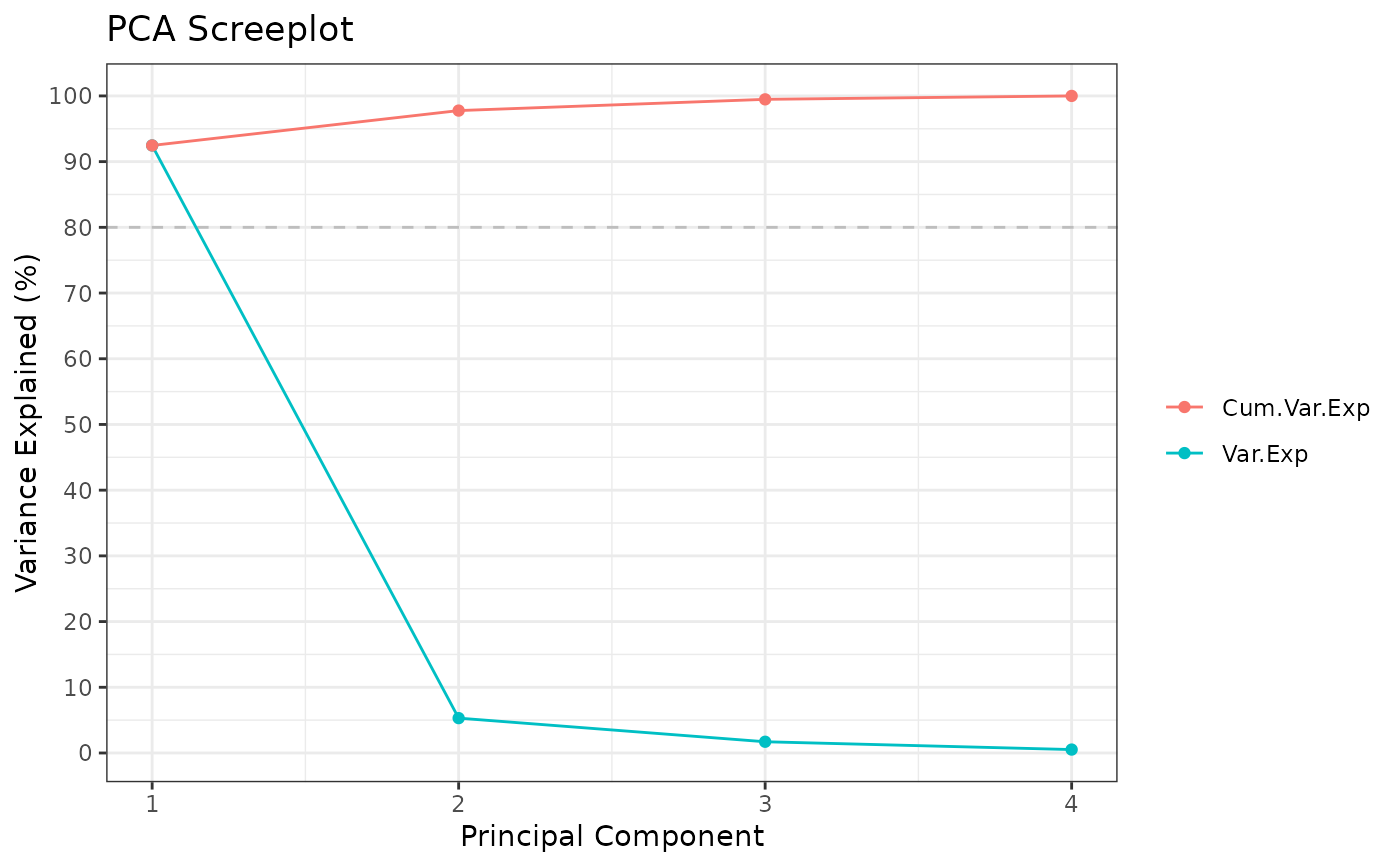
Rubrary::run_PCA(t(iris[,c(1:4)]))
#> ** Cumulative var. exp. >= 80% at PC 1 (92.5%)
 #> Standard deviations (1, .., p=4):
#> [1] 2.0562689 0.4926162 0.2796596 0.1543862
#>
#> Rotation (n x k) = (4 x 4):
#> PC1 PC2 PC3 PC4
#> Sepal.Length 0.36138659 -0.65658877 0.58202985 0.3154872
#> Sepal.Width -0.08452251 -0.73016143 -0.59791083 -0.3197231
#> Petal.Length 0.85667061 0.17337266 -0.07623608 -0.4798390
#> Petal.Width 0.35828920 0.07548102 -0.54583143 0.7536574
#> Standard deviations (1, .., p=4):
#> [1] 2.0562689 0.4926162 0.2796596 0.1543862
#>
#> Rotation (n x k) = (4 x 4):
#> PC1 PC2 PC3 PC4
#> Sepal.Length 0.36138659 -0.65658877 0.58202985 0.3154872
#> Sepal.Width -0.08452251 -0.73016143 -0.59791083 -0.3197231
#> Petal.Length 0.85667061 0.17337266 -0.07623608 -0.4798390
#> Petal.Width 0.35828920 0.07548102 -0.54583143 0.7536574